
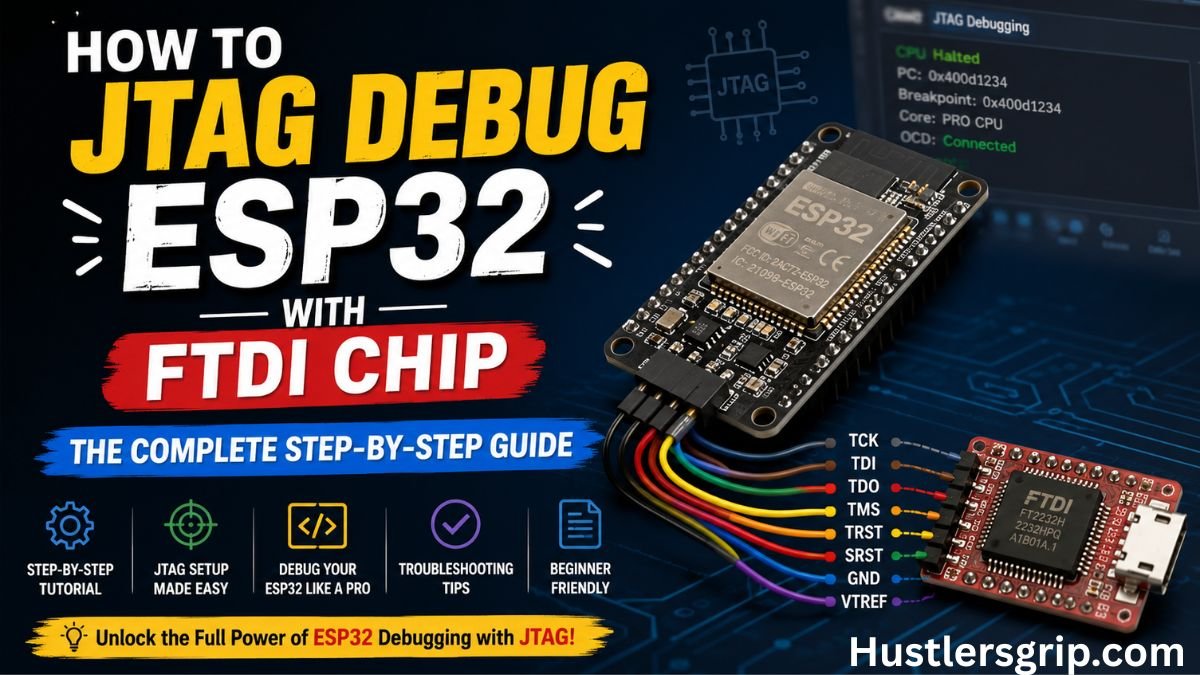
How to JTAG Debug ESP32 with FTDI Chip: The Complete Step-by-Step Guide
Introduction
How to JTAG Debug ESP32 with FTDI Chip , Have you ever spent hours trying to find a bug in your ESP32 code using only serial print statements? It is frustrating, slow, and often leaves you guessing. There is a better way. JTAG debugging lets you pause your code, inspect variables, set breakpoints, and step through instructions line by line. And the best part? You can do all of this with an affordable FTDI chip.
This guide will show you how to JTAG debug ESP32 with FTDI chip from start to finish. You don’t need expensive equipment or years of experience. Whether you are a hobbyist or a professional developer, this tutorial will help you set up a powerful debugging environment that saves time and makes coding more enjoyable.
What Is JTAG Debugging?
JTAG (Joint Test Action Group) is an industry-standard hardware interface that allows you to debug microcontrollers at the hardware level. With JTAG, you can pause your ESP32’s CPU, read and write memory, set breakpoints, and step through your code one instruction at a time. It gives you complete control over your chip while it runs, making it much easier to find and fix tricky bugs.
Quick Comparison: JTAG vs. Serial Debugging
| Feature | Serial (UART) Debugging | JTAG Debugging |
|---|---|---|
| Breakpoints | Not supported | Yes (hardware) |
| Step-through code | No | Yes |
| View registers | No | Yes |
| Inspect memory | Limited | Full access |
| Real-time control | No | Yes |
| Speed | Slow (115200 bps) | Fast (up to 20 MHz) |
| Cost | Free (built-in) | ~$10–$30 for FTDI |
What You Need Before You Start
Before diving into how to JTAG debug ESP32 with FTDI chip, gather these items:
Hardware Checklist
- ESP32 development board (any model like DevKitC, WROOM, or WROVER)
- FTDI chip or adapter (FT2232H, FT232H, or FTDI C232HM-DDHSL-0 cable)
- Female-to-female jumper wires (for connections)
- USB cable (to connect FTDI to your computer)
- Breadboard (optional, for prototyping)
Software Checklist
- ESP-IDF (Espressif IoT Development Framework)
- OpenOCD (Open On-Chip Debugger) – ESP32 version
- GDB (GNU Debugger) for Xtensa
- VS Code (optional but recommended)
- FTDI drivers (for your operating system)
Choosing the Right FTDI Chip for JTAG Debugging
Not all FTDI chips work for JTAG debugging. Here is what you need to know:
Recommended FTDI Chips
| Chip Model | JTAG Support | Speed | Best For |
|---|---|---|---|
| FT2232H | Yes (MPSSE) | High | Professional use |
| FT232H | Yes (MPSSE) | High | Hobbyists and pros |
| FT2232HL | Yes (MPSSE) | High | ESP-WROVER-KIT built-in |
| FTDI C232HM-DDHSL-0 | Yes | High | Ready-made cable |
The FT2232H and FT232H chips support MPSSE (Multi-Protocol Synchronous Serial Engine) mode, which allows them to generate JTAG signals. These are the chips you want.
Important Note on Voltage
ESP32 uses 3.3V CMOS logic for JTAG signals. Make sure your FTDI module supports 3.3V output. Most modern FTDI boards have a voltage selection jumper or are fixed at 3.3V.
Expert Tip: If you are using an ESP-WROVER-KIT board, it already has an FT2232HL chip built in. You don’t need an external FTDI adapter. Just enable JTAG with jumpers.
How to Wire ESP32 to FTDI for JTAG
Now we get to the hands-on part of how to JTAG debug ESP32 with FTDI chip. Proper wiring is critical. One wrong connection and nothing will work.
JTAG Signal Pins on ESP32
ESP32 uses four specific GPIO pins for JTAG:
| JTAG Signal | ESP32 GPIO Pin | FTDI Pin (FT2232H) |
|---|---|---|
| TMS (Test Mode Select) | GPIO14 | AD3 |
| TDI (Test Data In) | GPIO12 | AD1 |
| TCK (Test Clock) | GPIO13 | AD0 |
| TDO (Test Data Out) | GPIO15 | AD2 |
| GND | GND | GND |
FTDI C232HM-DDHSL-0 Cable Wiring
If you are using the FTDI C232HM-DDHSL-0 cable, here are the wire colors:
| Wire Color | FTDI Pin | ESP32 Pin | JTAG Signal |
|---|---|---|---|
| Brown | Pin 5 | GPIO14 | TMS |
| Yellow | Pin 3 | GPIO12 | TDI |
| Orange | Pin 2 | GPIO13 | TCK |
| Green | Pin 4 | GPIO15 | TDO |
| Black | Pin 10 | GND | GND |
Step-by-Step Wiring Instructions
- Power off your ESP32 board before making connections.
- Connect GND on FTDI to GND on ESP32.
- Connect TCK (FTDI) to GPIO13 on ESP32.
- Connect TMS (FTDI) to GPIO14 on ESP32.
- Connect TDI (FTDI) to GPIO12 on ESP32.
- Connect TDO (FTDI) to GPIO15 on ESP32.
- Double-check all connections before powering on.
Important Warnings
- Do not use GPIO12, GPIO13, GPIO14, or GPIO15 for anything else in your code. These pins are reserved for JTAG.
- Some ESP32 modules use GPIO12 as a strapping pin. You may need to pull it low or high during boot.
- Make sure your FTDI and ESP32 share a common ground.
Installing Required Software
Let’s set up the software side of how to JTAG debug ESP32 with FTDI chip.
Step 1: Install ESP-IDF
ESP-IDF is Espressif’s official development framework. It includes all the tools you need.
For Windows:
- Download the ESP-IDF installer from the Espressif website.
- Run the installer and follow the prompts.
- Select the components you want (include all tools).
For Linux/macOS:
bash
git clone --recursive https://github.com/espressif/esp-idf.git
cd esp-idf
./install.sh
. ./export.sh
Step 2: Install OpenOCD for ESP32
OpenOCD is the bridge between your FTDI chip and the debugging tools. Download the ESP32-specific version from the Espressif GitHub releases page.
For Windows:
- Download the
.exeinstaller or.zippackage. - Extract to a folder like
C:\openocd-esp32. - Add the
binfolder to your system PATH.
For Linux/macOS:
- Download the
.tar.gzfile. - Extract it:
tar -xzf openocd-esp32-*.tar.gz. - Add the
binfolder to your PATH.
Step 3: Install FTDI Drivers
Windows:
- Windows usually detects FTDI chips automatically.
- If not, download the driver from FTDI’s website.
- For JTAG, you may need to replace the default driver with WinUSB using Zadig tool.
macOS:
- macOS includes a default FTDI serial driver that can conflict with JTAG.
- You may need to unload the serial driver before using OpenOCD.
Linux:
- FTDI drivers are built into the kernel.
- You may need to add udev rules for non-root access.
Setting Up OpenOCD for ESP32
OpenOCD uses configuration files to know which hardware you are using. Here is how to set it up for how to JTAG debug ESP32 with FTDI chip.
Basic OpenOCD Command
The simplest way to start OpenOCD is:
bash
openocd -f board/esp32-wrover-kit-3.3v.cfg
This command uses a predefined configuration file for the ESP-WROVER-KIT.
For Custom FTDI Adapters
If you are using a generic FTDI adapter, you may need:
bash
openocd -f interface/ftdi/esp32_devkitj_v1.cfg -f target/esp32.cfg
Sample OpenOCD Configuration
Create a custom configuration file (e.g., esp32-jtag.cfg):
tcl
# Interface configuration
source [find interface/ftdi/esp32_devkitj_v1.cfg]

# Target configuration
source [find target/esp32.cfg]

# Set JTAG speed
adapter speed 20000
The adapter speed 20000 sets the JTAG clock to 20 MHz.
Running OpenOCD
- Open a terminal or command prompt.
- Navigate to your project folder.
- Run the OpenOCD command.
- You should see output like:
text
Info : ftdi: if you experience problems at higher adapter clocks, try the command "ftdi_tdo_sample_edge falling"
Info : JTAG tap: esp32.cpu0 tap/device found
Info : Listening on port 3333 for gdb connections
If you see tap/device found, your wiring is correct.
Connecting GDB for Debugging
OpenOCD runs a GDB server on port 3333. Now you connect GDB to start debugging.
Start GDB
Open another terminal and run:
bash
xtensa-esp32-elf-gdb build/your_project.elf
Connect to OpenOCD
Inside GDB, type:
text
target remote localhost:3333
Basic GDB Commands
| Command | What It Does |
|---|---|
break main | Set breakpoint at main function |
continue or c | Run the program |
step or s | Step into next instruction |
next or n | Step over next instruction |
print variable | Show variable value |
info registers | Show all CPU registers |
quit | Exit GDB |
Using VS Code for JTAG Debugging
VS Code makes how to JTAG debug ESP32 with FTDI chip much easier with a graphical interface.
Step 1: Install Extensions
- Espressif IDF extension
- C/C++ extension
Step 2: Configure Launch Settings
Create a .vscode/launch.json file:
json
{
    "version": "0.2.0",
    "configurations": [
        {
            "name": "ESP32 JTAG Debug",
            "type": "cppdbg",
            "request": "launch",
            "program": "${workspaceFolder}/build/your_project.elf",
            "miDebuggerPath": "xtensa-esp32-elf-gdb",
            "miDebuggerServerAddress": "localhost:3333"
        }
    ]
}
Step 3: Start Debugging
- Run OpenOCD in a terminal.
- In VS Code, go to the Run and Debug panel.
- Select “ESP32 JTAG Debug”.
- Click the green play button.
- Set breakpoints by clicking next to line numbers.
Common Mistakes and How to Avoid Them
Here are the most common pitfalls when learning how to JTAG debug ESP32 with FTDI chip:
Mistake 1: Using JTAG Pins in Your Code
The Problem: Your code uses GPIO12, GPIO13, GPIO14, or GPIO15 for other purposes.
The Fix: Check your code and make sure these pins are not used. Comment out any references to these GPIOs.
Mistake 2: Wrong Wiring
The Problem: TMS, TDI, TCK, and TDO are mixed up.
The Fix: Double-check each connection. Use the wiring table above.
Mistake 3: Missing Ground Connection
The Problem: FTDI and ESP32 do not share a common ground.
The Fix: Always connect GND from FTDI to GND on ESP32.
Mistake 4: Driver Conflicts
The Problem: The operating system loads a serial driver for the FTDI’s JTAG channel.
The Fix: On Windows, use Zadig to change the driver to WinUSB. On macOS, unload the serial driver before starting OpenOCD.
Mistake 5: Forgetting to Enable JTAG in Firmware
The Problem: JTAG is disabled in the ESP32 configuration.
The Fix: In your project configuration (idf.py menuconfig), enable:
text
Component config → ESP32-specific → Support for external, SPI-connected RAM → Enable JTAG
Or set CONFIG_ESP32_DEBUG_OCDAWARE=y.
Troubleshooting JTAG Connection Issues
Even with perfect wiring, things can go wrong. Here is how to fix common problems.
Error: “JTAG scan chain interrogation failed: all zeroes”
What it means: OpenOCD cannot detect the ESP32.
Solutions:
- Check all wiring connections.
- Make sure ESP32 is powered.
- Verify your FTDI chip is properly connected to USB.
- Try a lower clock speed:
adapter speed 1000.
Error: “JTAG scan chain interrogation failed: all ones”
What it means: The TDO pin is stuck high.
Solutions:
- Check the TDO connection (GPIO15).
- Make sure GPIO15 is not pulled high or low externally.
- Try adding
ftdi_tdo_sample_edge fallingto your config.
Error: “unable to open ftdi device”
What it means: OpenOCD cannot find your FTDI chip.
Solutions:
- Check USB connection.
- On Windows, use Zadig to install WinUSB driver.
- On Linux, check permissions (
sudoor udev rules). - On macOS, unload the serial driver.
Error: “TDI/TDO mismatch”
What it means: The FTDI chip cannot read the ESP32’s response.
Solutions:
- Check the TDI and TDO connections.
- Verify the ESP32 is not in a reset state.
- Try adding pull-up resistors (10kΩ) on JTAG lines.
Pros and Cons of JTAG Debugging with FTDI
Pros
| Advantage | Why It Matters |
|---|---|
| Hardware breakpoints | Pause code at exact locations |
| Real-time control | Start, stop, and step through code |
| Memory inspection | See variables and registers live |
| Affordable | FTDI chips cost $10–$30 |
| Industry standard | Works with many tools and IDEs |
| No serial clutter | Clean debug output without print statements |
Cons
| Disadvantage | How to Work Around |
|---|---|
| Extra hardware | Buy an FTDI adapter |
| Wiring required | Follow the wiring guide carefully |
| Driver setup | May need Zadig on Windows |
| Pins reserved | Cannot use GPIO12–15 |
| Learning curve | Takes time to learn GDB commands |
You May Also Like
- Henan Huatai Machine – Industrial Insights
- Jarastanulas Manko Nelkul – Practical Tips
- Lincplus P1 Offnen – How-To Guide
- Kacha Kela Fugi Actress – Entertainment News
Final Thoughts and Call to Action
Learning how to JTAG debug ESP32 with FTDI chip opens up a whole new level of development efficiency. Instead of guessing what your code is doing, you can see it in real-time. You can pause execution, inspect variables, and step through complex logic. This saves hours of frustration and makes you a better developer.
The setup process may seem intimidating at first, but once you have it working, you will wonder how you ever coded without it. Start with the wiring, install the software, and run your first debug session. The confidence you gain from having full control over your ESP32 is worth every minute of setup time.
Frequently Asked Questions
1. Can I JTAG debug ESP32 with any FTDI chip?
No. You need an FTDI chip that supports MPSSE mode, like the FT2232H or FT232H. Standard UART FTDI chips (like FT232R) do not support JTAG.
2. Do I need to remove the ESP32 from my circuit to use JTAG?
No. JTAG works with the ESP32 in your circuit. Just make sure the JTAG pins (GPIO12–15) are not connected to other components.
3. Why does OpenOCD say “tap/device not found”?
This usually means a wiring problem. Check all connections, especially GND. Also make sure your ESP32 is powered and not in reset.
4. Can I use JTAG and serial (UART) at the same time?
Yes, but be careful. Some FTDI chips use one channel for JTAG and another for serial. On Windows, you may need to use Zadig to set the JTAG channel to WinUSB.
5. Is JTAG debugging faster than serial debugging?
Yes, much faster. JTAG operates at speeds up to 20 MHz, while serial UART is typically 115200 bps. JTAG also gives you more control over the chip.
6. What is the difference between JTAG and SWD?
JTAG uses 4–5 signals (TCK, TMS, TDI, TDO, TRST). SWD (Serial Wire Debug) uses only 2 signals and is used on ARM chips. ESP32 uses JTAG.
7. Can I debug both ESP32 cores with JTAG?
Yes. OpenOCD supports both PRO_CPU and APP_CPU cores. You can debug dual-core applications.
8. Do I need to modify my ESP32’s firmware for JTAG?
Yes, you should enable CONFIG_ESP32_DEBUG_OCDAWARE in your project configuration. This ensures the JTAG interface is active.

Related Posts

Droven.io DevOps Tutorials : Your Complete Beginner Guide to Master DevOps in 2026

Olitt Plumber AI Builder: The Ultimate Guide to Building Your Plumbing Website in Minutes
